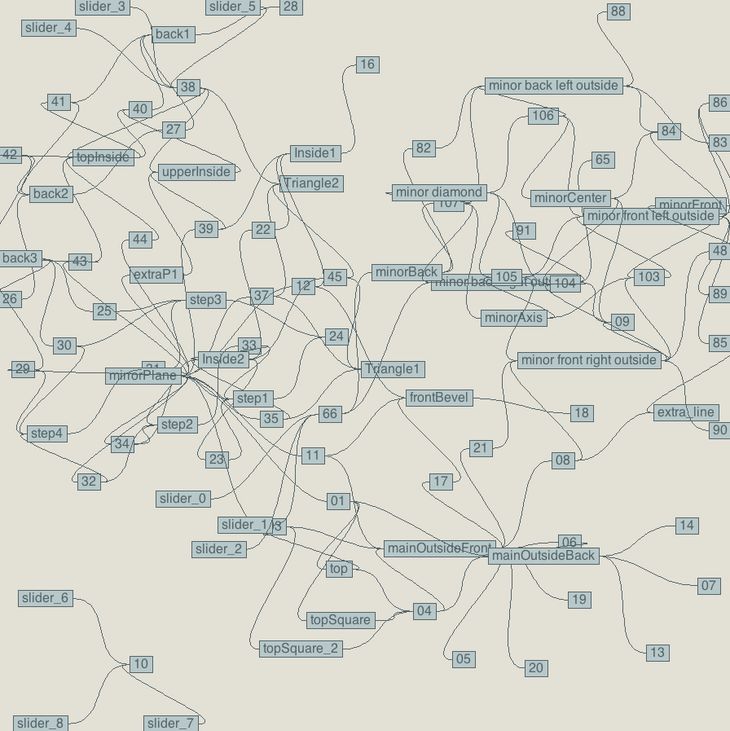
Just finished a tool to visualise directed graphs in processing. It uses the bezier curve & box combination from Grasshopper, but since the visualisation is not a development tool, the nodes the free to float into place. I created it to expose the underlying schema of a parametric tool we are developing but it could be modified to display any directed graph /& relational graph.
The full source is available under creative commons, here on open processing.